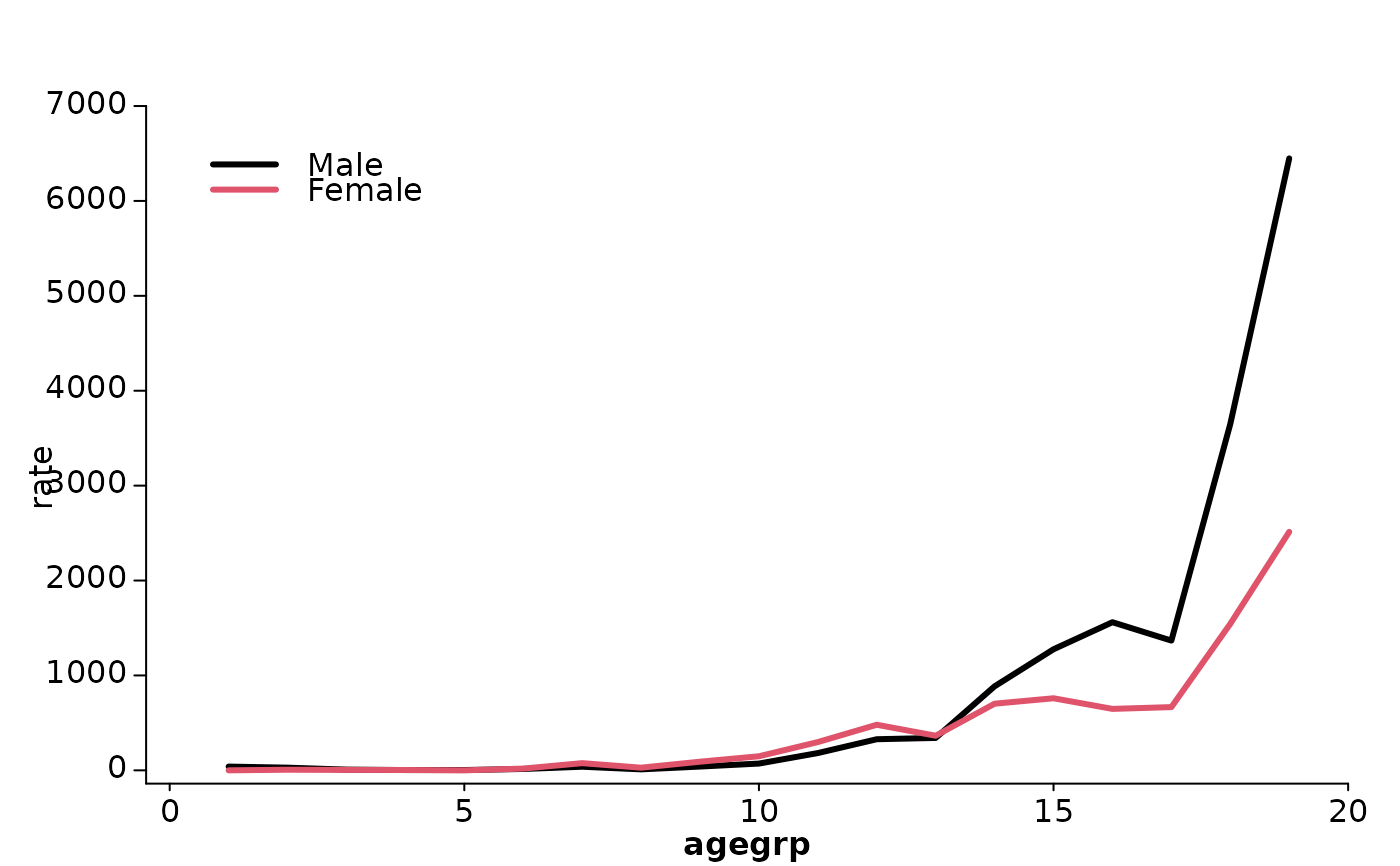
Plot line chart
draw_line.RdPlot line chart
Usage
draw_line(
  data,
  x_var,
  y_var,
  group_var,
  y_axis = NULL,
  x_axis = NULL,
  col = NULL,
  main = NULL,
  ...
)
Arguments
- data
The input data frame.
- x_var
The variable for the x-axis.
- y_var
The variable for the y-axis.
- group_var
The variable used to group the data for multiple lines.
- y_axis
Optional. The custom Y-axis tick values. If not provided, the function generates them.
- x_axis
Optional. The custom X-axis tick values. If not provided, the function generates them.
- col
Optional. The colors for the lines. If not provided, the function uses default colors.
- main
Optional. The title of the plot.
- ...
Other parameters.
Examples
library(canregtools)
file <- system.file("extdata", "411721.xls", package = "canregtools")
data <- read_canreg(file)
#> 2200  cases were read from FB sheet.1470  cases were read from SW sheet.
fbsw <- count_canreg(data, lang = "en")
age <- create_age_rate(fbsw, sex)
draw_line(age, agegrp, rate, sex)